Winchester Cycling Charter
Supporting evidence
The evidence to support investment in schemes that encourage more people to cycle has three main strands:
- Strand 1
- Cycling can make a significant contribution to tackling many of the pressing problems currently facing society: widespread obesity, mental health issues, congested cities, air pollution and poor quality of life.
- Strand 2
- Creating an environment where more people choose to cycle (and walk) can provide a positive stimulus to businesses and the economy and make places more attractive to live, to work and to visit.
- Strand 3
- Most people are in favour of measures to promote cycling.
PlaceValueWiki, a website1 for sharing academic research on the value of place makes a powerful over-arching statement on its front page that
“there is a VERY strong positive association between place derived value … and the walkability and bikeability of places”
and is clear about the wide-ranging positive effects of place derived value – what we might loosely call the quality of our surroundings, namely that
“the overwhelming nature of the evidence – the vast majority of which points in the same broad direction – is that better place quality adds value economically, socially and as regards health and environmental outcomes. Indeed the impacts of place are profound, contribute benefits to society over short, medium and long-term time horizons, and reverberate throughout the lives of citizens across all socio-economic strata and globally.”
A quick read
If short of time, the best two snapshots of the breadth of evidence for Strand 1 and Strand 2 are a report2 by Transport for London called Walking and Cycling: The Economic Benefits and a briefing document3 from Cycling UK, called Cycling and the Economy.
This document also highlights that Cycling is for All – age, fitness and disability are not the barriers that people imagine. And cycling is becoming popular for freight purposes too, not just personal transport.
Some example cities are briefly reviewed that give a glimpse of what Winchester should aspire to, as well as a consideration of our own local, Winchester context.
The conclusion speaks for itself.
Lose yourself in the references if you have a few hours spare!
Evidence for strand 1
Getting more people cycling helps to tackle major societal problems: mental and physical well-being, pollution and congestion.
The European Cyclists’ Federation published a report4 in 2018 that estimated the global annual benefit of current levels of cycling to be worth 150bn euros, summarised in the graphic below.
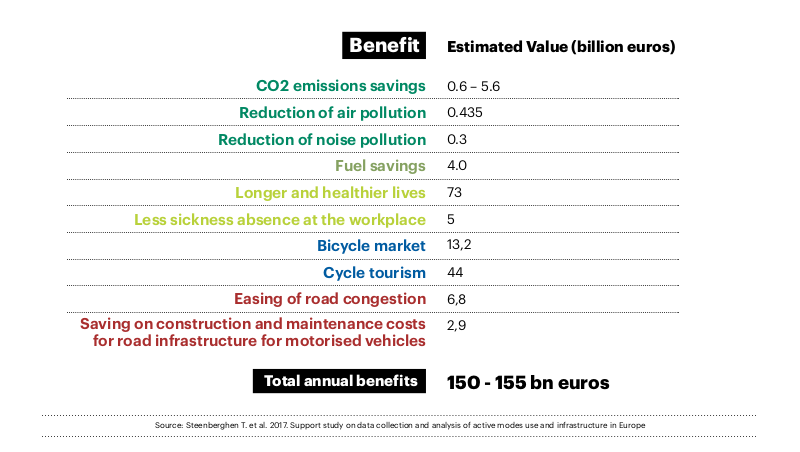
A briefing document3 from Cycling UK additionally mentions the potential benefits that cycling brings from fewer casualties on the road and less damage to buildings, ecosystems and agriculture from pollution.
A recent EU Civitas Policy Note5 makes the point that cyclists do not emit any air pollutants. Cities are faced with the challenge to reduce the amount of emitted air pollutants since long-term exposure to particulate matter is estimated to be responsible for over 400,000 deaths in 2012 for all EU-28 countries (European Environment Agency, 2015).
A 2019 Bike Life report6 by Sustrans for Southampton City Council estimated that every year cycling in the city prevents 191 serious long-term health conditions and saves 8,800 tonnes of greenhouse gas emissions.
Eight UK cities [Birmingham, Cambridge, Manchester, Newcastle, Norwich, Oxford, Bristol, Leeds] are involved in the Cycle City Ambition (CCA) programme. An Interim Report7 for the Department for Transport indicated that in 14 schemes across the 8 cities at least 440,000 car trips per year are estimated to have switched to cycle trips as a direct result of CCA-funded infrastructure. The increase in cycling volumes is estimated to have resulted in a reduction in car use of slightly under 2 million km per year, with an associated reduction in annual carbon dioxide emissions of 0.5 kilotonnes.
A 2017 press release8 by INRIX related to their Global Traffic Scorecard showed the UK ranked as the 10th most congested country in the world. The direct and indirect costs of congestion to all UK motorists amounted to over £37.7 billion. Their chief economist was led to comment “the cost of congestion is astonishing … with more cars on the road than ever before, we need to consider innovative new approaches to solving the issue”.
The iconic image9, below, commissioned for a poster by the planning department of the city of Münster, Germany is a simple and compelling argument for how cycling can help overcome the problems of congested cities. The image is a triptych consisting of three images taken from the same angle, showing the space occupied by bicycles, cars and buses when each transported 72 people.

(Photo commissioned by the city of Münster)
A DfT report10 reviewed the Sustainable Travel Towns programme which ran from 2004 to 2009, with £10 million funding for the implementation of large-scale Smarter Choice Programmes in three towns: Darlington, Peterborough and Worcester. All three programmes aimed to encourage more use of non-car options – in particular, bus use, cycling and walking – and less single-occupancy car use. Based on the decongestion benefits alone, the programme’s benefit cost ratio (BCR) has been estimated as 4.5:1.
Segregated cycle lanes on Blackfriars Bridge helped move 5% more people along the street in peak-time according to TfL analysis2.
A ‘mini-Holland’ pilot scheme11 in Waltham Forest cut traffic by half.
London Living Streets examines research12 around the issue of ‘disappearing traffic’ and notes that predictions of traffic problems caused by low-traffic neighbourhoods almost always fail to materialise. Significant reductions in overall traffic levels across an area can happen as a result of people making a wide range of behavioural responses to new traffic configurations.
In a Guardian article13 urban designer Mikael Colville-Andersen discusses congestion and the use of space in Copenhagen, often seen as an exemplar for good cycling infrastructure. Across the city bikes are used for 62% of commutes; yet get 7% of space. Cars are used for 9% of commutes; yet get 54% of space. He suggests that changing models from the current framing of ‘how many cars can we get down this street’ to ‘how many people can we get down this street’ [ie using a mixture of car lanes, public transport lanes, cycle-ways, wider pavements] has the potential to increase capacity ten-fold.
A briefing paper14 by Public Health England outlines in detail the physical and mental health benefits of cycling. “Switching more journeys to active travel will improve health, quality of life and the environment, and local productivity, while at the same time reducing costs to the public purse. These are substantial ‘win-wins’ that benefit individual people and the community as a whole”
- physical inactivity directly contributes to 1 in 6 deaths in the UK and costs £7.4 billion a year to business and wider society
- the growth in road transport has been a major factor in reducing levels of physical activity and increasing obesity
- building walking or cycling into daily routines are the most effective ways to increase physical activity
- short car trips (under 5 miles) are a prime area for switching to active travel and to public transport
- health-promoting transport systems are pro-business and support economic prosperity. They enable optimal travel to work with less congestion, collisions, pollution, and they support a healthier workforce.
On a similar health theme the British Heart Foundation15 list ten good reasons to cycle. Heart health is unsurprisingly top of their list but they also make clear that cycling is suitable for all levels of fitness. They also quote Dr Stephen Watkins, co-chair of the Transport and Health Study Group who says that the benefits are many times greater than any risk of injury.
Department for Transport sponsored research16 shows that children who walk or cycle to school tend to be more attentive and achieve greater results.
A paper17 in the journal Preventive Medicine showed that active commuting improved psychological wellbeing. The National Institute for Clinical Excellence (NICE) noted that the paper supported its recommendations for active travel. Researchers found that people who walked or cycled to work benefitted from improved mental wellbeing … in a number of areas such as concentration, the ability to make decisions and enjoy normal daily activities, and that it reduced the feeling of being constantly under strain. This is in addition to the known physical health benefits associated with walking and cycling, such as reduced risk of coronary heart disease, cancer, stroke, and type 2 diabetes. The research included data on around 18,000 commuters from across the UK over a period of 18 years.
A review paper18 published in the Scandinavian Journal of Medicine & Science and Sports on the health benefits of commuting cycling indicated consistent improvements in cardiovascular fitness and some improvements in cardiovascular risk factors amongst working-age adults.
A 2017 paper19 in the British Medical Journal similarly indicated that cycle commuting was associated with a lower risk of cardiovascular disease, cancer, and all-cause mortality.
A paper20 in the Journal of Environment and Behavior showed car commuting was associated with “lower levels of social participation and general trust”.
Evidence for strand 2
Getting more people cycling leads to business and economic benefits and creates attractive, welcoming cities.
A 2016 paper21 in Transportation Research Procedia titled Economic Benefits of Increased Cycling concludes that “cycling is not only improving the liveability of cities, public health, air quality, or the CO2 balance it also creates hard economic value and jobs”
A Bloomberg CityLab report22 reviewed the evidence for fifteen major city studies (across USA, Canada, UK, Ireland, Australia and New Zealand) where car parking spaces had been replaced by bike lanes. Cyclists were found to be ‘competitive consumers’ who more often than not outspent drivers and were also more frequent visitors. Traders consistently over-estimated the proportion of customers who arrived by car and the proportion of takings attributable to car drivers. For example in Bristol traders thought their customers lived farther away than they really did and assumed that 41% drove to their shops rather than the actual figure of 22%. And in Dublin traders on the two main shopping streets considerably over-estimated spending by shoppers travelling by car.
In a similar vein, former New York City transportation commissioner Janette Sadik-Khan, in a Bloomberg CityLab interview23 says, ‘Reclaiming road space for bikes, pedestrians, and buses isn’t a mere amenity, it’s an infrastructure and economic investment whose effects are felt far beyond the lane. So if you want better streets for everyone, you can start by building a bike lane’.
The Pedestrian Pound, a 2018 report24 prepared by independent experts for Living Streets concluded that business owners and organisations still over-value the importance of parking and car access to their footfall and sales revenue. Business organisations need to be aware of the evidence in this area to promote the economic benefits of walkability, public spaces and provision for cycling and active transport users to members.
Department for Transport sponsored research16 mentioned earlier with regard to well-being was primarily commissioned to look at the economic value of cycling. It came up with the following conclusions:
- Economic growth can result from high density, cycle friendly urban design
- Reduced infrastructure maintenance costs come with catering for active travel and are typically 33% lower.
- A compact town optimised for walking and cycling typically delivers a ‘retail density’ (spend per square metre) 2.5 times higher than typical urban centres.
- Residential property values rise 1% when motor traffic is reduced 50%
The briefing document3 Cycling and the Economy from Cycling UK notes that the cost benefit analysis used by Copenhagen to decide whether to build new cycling infrastructure, concluded that cars cost society and private individuals six times more than cycling.
The Value of the Cycling Sector to the British Economy: A Scoping Study25 carried out for the Bicycle Association in 2018 calculated that cycling generates around 64,000 FTE jobs in the UK including jobs in tourism, sales and repair, cycle delivery, manufacturing, and cycle infrastructure. The cycling industry is estimated to be worth £5.4 billion a year to the economy, with the larger share of this, £4.1billion, coming from wider impacts, particularly reductions in loss of life, and reduced pollution and congestion. The study notes that this is a larger contribution than made by the UK steel industry.
An earlier report26 along the same lines, The British Cycling Economy, by the London School of Economics found that even in 2011 over £500m generated in wages and £100m in taxes from 23,000 employed directly in bicycle sales, distribution and the maintenance of cycling infrastructure.
Close to home and much more recently the 2019 Bike Life report5 by Sustrans for Southampton City Council calculates that current cycling activity already creates £50.1 million in economic benefit for individuals and the city.
Even closer to home Winchester currently has six main bike retailers bringing employment and economic activity to the city. One of these retailers has only recently taken over large previously empty premises in the city centre – in the middle of a crisis of confidence in town centres and a global pandemic. The cycling industry is booming.
Winchester has attractions for visiting cyclists. It is located at the start of two long distance off-road routes (South Downs Way and King Alfred’s Way) and is adjacent to Hampshire’s intricate network of lanes and back roads through attractive countryside. The city has a clear opportunity to market itself as a cyclist-friendly city: a destination, not just a jumping-off point.
High Streets for All a 2017 report27 authored by LSE Cities for the Greater London Authority noted “for those living locally, successful high streets minimise the need for multiple car journeys, and encourage walking, cycling and the use of public transport.”
A report28 by UCL commissioned by Transport for London, called Street Appeal noted that “those cities that have failed to integrate the multi-functionality of streets tend to have lesser infrastructure development, lower productivity, a poorer quality of life … “
A report29 by New York City Department of Transportation used retail sales to provide the most direct and reliable indicator of the health of local businesses. Applying this methodology to a range of projects including pedestrian plazas, bike paths, intersection redesigns and bus rapid transit provided convincing evidence that “improved accessibility and a more welcoming street environment created by these projects generate increases in retail sales”.
A 2010 paper30 in the journal Preventive Medicine concluded that cycling to work is associated with less sickness absence. The more often people cycle to work and the longer the distance travelled, the less they report sick.
A survey31 of London’s Business Improvement Districts (BIDS) showed their belief that creating great environments for walking and cycling is important for business. Making it easier to walk and cycle is seen to boost the vitality of areas, increase footfall and 73% said it helped attract and retain staff.
A report2 by Transport for London notes that 73% of employees who cycle to work feel it makes them more productive. Additionally 54% of people who cycle to work feel ‘happy and energised’ during their commute.
Cycling Works32 is an initiative supported by200 leading employers in London across all major sectors of the economy. As they say, “Our employees cycle and they deserve appropriate infrastructure”. This links to evidence from a British Council of Offices Report33 that “the demand for workplace cycling facilities was increasing and for some people they were a deciding factor in where to work”.
Businesses using cycle freight have been found16 to save between 39 and 64% on delivery costs.
Evidence for strand 3
The majority of the population are in favour of investment to create more space for safe cycling.
A recent report34 for the Department for Transport showed two-thirds of respondents were supportive of reallocating road space to walking and cycling across towns and cities in England.
The Bike Life report6 by Sustrans for Southampton City Council revealed that
- 78% of residents think that more cycle tracks along roads physically separated from traffic and pedestrians would be useful to help them cycle more.
- 71% of residents support building more of these tracks, even when this means less room for other road traffic.
- 61% residents think more cycling would make their area a better place to live and work.
The 2019 Bike Life report35 by Sustrans covered 12 Bike Life cities and in an independent survey involving nearly 17000 of their residents 77% thought that more cycle tracks along roads physically separated from traffic and pedestrians would be useful to help them cycle more and 68% support building more of these tracks, even when this means less room for other road traffic.
A recent YouGov poll36 commissioned by BikeisBest showed the public is overwhelmingly in favour of measures to encourage walking and cycling with 6.5 people supporting changes to their local streets for every 1 person against. 70% of respondents believe more people cycling would reduce traffic congestion across the country and 65% of all Britons – rising to 80% of those with an opinion one way or the other – want to see British roads redesigned and changed to protect cyclists and pedestrians from cars.
In a YouGov poll37 reported in the Guardian positive views on Low Traffic Neighbourhoods were found to be three times higher than negative ones.
An Interim Report7 of the Cycle City Ambition (CCA) programme noted strong public support for improving the safety of cycling. A large majority of the general public (7-8 in 10 of those surveyed in four of the cities) believed that the safety of cycling in their city should be improved.
Smarter people make smarter choices. Winchester’s population is under-represented against the national average in the 25-35 age-group. Younger people are generally more conscious of environmental issues and want to make appropriate lifestyle choices.
The Winchester Cycling Charter is about harnessing the voices of the people who already live and work here. But it’s important not to ignore the views of those people the city would like to attract: particularly talented young people who might choose to work, to settle, to raise a family and to contribute to the life of the city.
A report33 mentioned earlier notes that “the quality and availability of workplace cycle facilities influenced the career choices of more than half of respondents”. It’s not hard to extrapolate a similar effect related to the quality and availability of cycling facilities in reaching that workplace.
Cycling for all
Many of the quoted references draw attention to the fact that people in socio-economic groups D-E are disadvantaged by not having a car, 46% in Southampton according to the BikeLife report5. Cycling is a very affordable alternative that can improve people’s mobility and avoid what is called ‘transport poverty’ (exclusion from employment and healthcare because of lack of affordable transport) but it needs to be made a safe and attractive option.
Electric bikes extend the commuting range, make cycling accessible for the elderly and make cycling in hilly towns and cities less forbidding.
Cargo bikes and freight bikes are important as they can extend both the reach and the role of cycling.
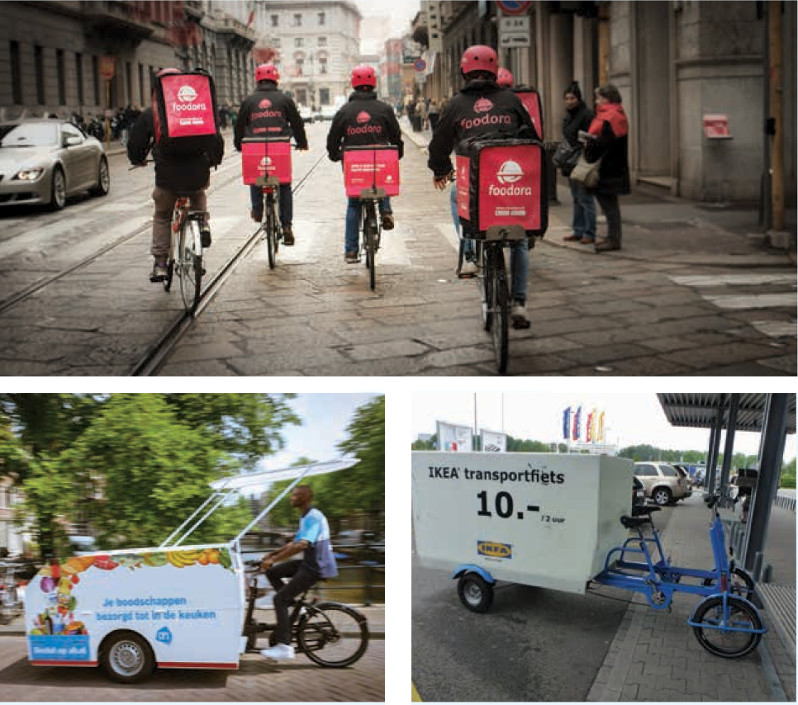
(Photos by SnapItaly, Albert Heijn and AutoKiosk)
As well as electric bikes there is a growing range of types of cycles and adaptations to them38 39, which make cycling much more accessible to those with physical challenges.
Wheels for Wellbeing have published A Guide to Inclusive Cycling40. Their aim as a charity is to increase awareness of the fact that disabled people can and do cycle.
Cycle lanes can also open up a new network to the elderly and disabled who can’t cycle but use wheelchairs and mobility scooters.
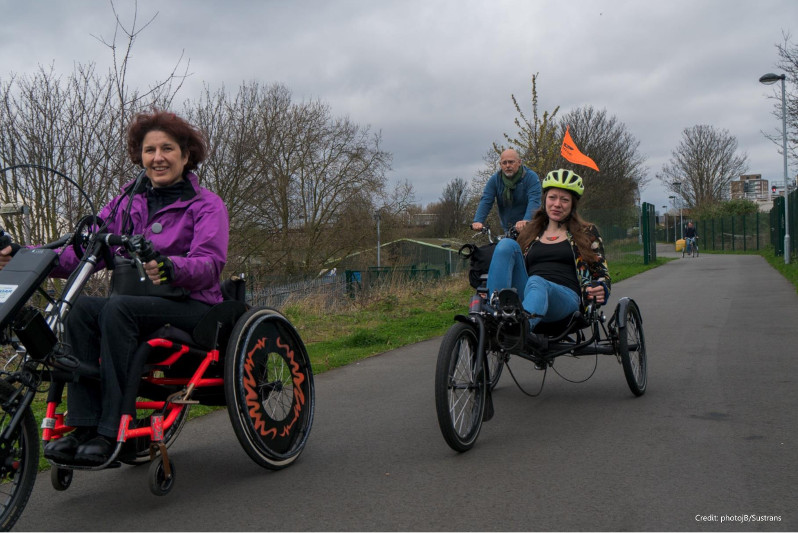
(Photo by photojb/Sustrans)
Research2 by Transport for London found that 87% of their customers said they could cycle including 3 out of 4 people aged 65+ and 76% of disabled people.
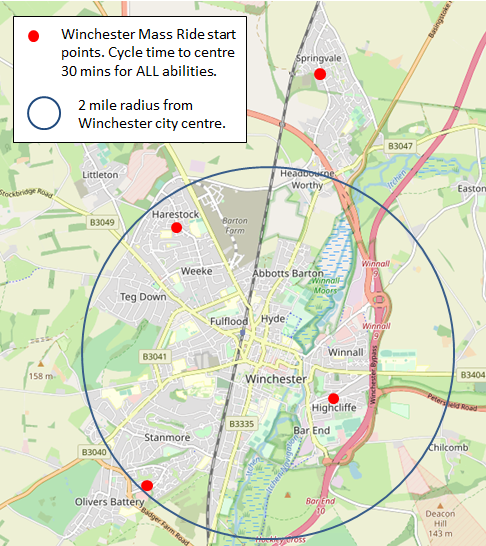
According to the National Travel Survey41, in 2017-18 over 40% of urban journeys were under 2 miles – perfectly suited to walking and cycling.
The map shows a 2-mile radius circle from the centre of the city showing how feasible cycling is for the majority of residents.
The Cycle Winchester Mass Ride is open to all ages and abilities and is timed to take a maximum of 30 minutes into the city from any of the marked start points.
Example cities
Cities in the UK tend to be well behind their counterparts in mainland Europe when it comes to provision for cycling. The Copenhagenize Index is the most comprehensive ranking of bicycle-friendly cities in the world. The top ten (in order) in 2019 were Copenhagen, Amsterdam, Utrecht, Antwerp, Strasbourg, Bordeaux, Oslo and Paris.
Copenhagen City of Cyclists: Bicycle Account 201642 gives a good snapshot of the city.
A short video43 about cycling in Amsterdam shows how pervasive and transformational life on wheels can be, although Winchester obviously doesn’t have barges for storing bikes!
Another video44 demonstrates what can be achieved when a city makes plans that are based on giving priority to pedestrians and cyclists. Utrecht boasts the busiest bike street in Holland carrying 33, 000 cyclists per day.
According to BikeRadar’s analysis of the data45 the most popular city for cycling in the UK is Cambridge, 33% of whose residents cycle at least three times a week. Next comes Oxford (22%) followed by York, Exeter, Norwich and Manchester. What does Cambridge do well? It has over 80 miles of dedicated cycle lanes and routes; restrictions on car-parking permits; road priority given to cyclists in key busy spots; and business incentives to establish bike hire and bike parking facilities in the city. This video46 gives a more complete overview. One contributor notes the knock-on effect “once you have enough cyclists, behaviour starts to change and more people are comfortable cycling”.
The same article45 names other cities making greatest improvements:
- Leicester – a cycle-biased street planning initiative, Connecting Leicester, has seen cycling overtake driving and taking the bus as the main vehicle for visitors travelling to the shops in the city.
- Liverpool – following the city’s successful Bike2Work scheme, Liverpool’s council pledged a substantial investment in the creation of a network of safe cycle routes and safety improvements as part of a ‘Cycling Revolution’ strategy aiming to increase the numbers of people cycling regularly by 2017 from 15,000 to 45,000.
A good example in the UK where there has been sustained investment in cycling over a number of years is Waltham Forest. This video47 gives a flavour of what has been achieved over five years.
In 2008 Bristol was named Britain’s first ‘cycling city’. Between 2001 and 2011 it nearly doubled the number of cycle commuters. It has continued to invest in cycling and is proposing some major improvements to the city through EATF funding, one example seen here48.
In 2005, Cycling England launched a Cycling Demonstration Town (CDT) programme to invest in measures to stimulate increased levels of cycling through combinations of physical infrastructure, promotion and other smart measures. The towns selected were Aylesbury, Brighton and Hove, Darlington, Derby, Exeter and Lancaster with Morecambe. A summary DfTreport10 concluded that for each pound invested, the programme’s impact in terms of reduced adult mortality alone was worth £2.59. The study data was also used to estimate a 30 year benefit-to-cost ratio of between 4.7:1 and 6.1:1. The same report assessed Cycling Ambition Grants which made in 2013-2015 to Greater Manchester, West Yorkshire, Birmingham, West of England Partnership, Newcastle, Cambridge, Norwich and Oxford and found a benefit-to-cost ratio of 5.5:1.
Winchester context
Our city and county authorities have taken on board the messages of Strands 1 and 2 as evidenced in the four policy documents below.
- City of Winchester Movement Strategy (HCC/WCC)
- There is “a strong mandate to address air quality issues, helping to make Winchester a healthier, more pleasant and less polluted environment; to develop new options that prioritise safe travel for both pedestrians and cyclists; to facilitate opportunities for people to leave their cars outside of the city centre and travel in by other means; and to give people more choice of transport modes.”
- Carbon Neutrality Plan (WCC)
- “Transport accounts for 36% of the council’s carbon emission and residents saw this as the top priority for the council to address and as action for individuals. Transport accounts for nearly half of the district carbon emissions and tackling this is the council’s first priority.
Proposed priority actions include taking forward key studies in the City of Winchester Movement Strategy which have a focus on achieving carbon emission reduction eg within the Walking & Cycling Strategy.” - Local Transport Plan LTP (HCC)
- Encouraging cycling is a key theme within the LTP (2011- 2031) where Policy 12 seeks investment “in sustainable transport measures, including walking and cycling infrastructure, principally in urban areas, to provide a healthy alternative to the car for local short journeys to work, local services or schools; and work with health authorities to ensure that transport policy supports local ambitions for health and well-being”.
Cycling supports many policy agendas including in public health, economic development, tourism and the environment.
Cycling has the potential to support a wide range of the priorities set within the County Council’s Corporate Strategy. - Climate Change Strategy (HCC)
- To enable, support and deliver a reduction in transport-related carbon emissions to net zero by 2050 and a resilient transport network. The priority for Transport will be to work with partners to develop a more holistic approach for communities and places that ultimately reduces the need to travel, increases the uptake of walking, cycling and public transport …
The Winchester Cycling Charter concentrates on Strand 3.
It is designed to demonstrate that – in line with the general UK population – there is strong support locally in Winchester for making the city a safer, easier and more pleasant place to get around by cycling.
Conclusion
There is strong evidence to show that getting more people to cycle in Winchester will be beneficial for our city by overcoming the problems already stated and by providing an economic stimulus and cultural shift that helps create a more vibrant and sustainable future.
Cycling is accessible to virtually anyone and the biggest barrier to getting on a bike is usually a lack of safe and easy to use cycle infrastructure.
Most people are in favour of making cycling easier and safer. Demonstrating there is that pro-cycling consensus in Winchester can create momentum for the necessary change. It gives our authorities both the confidence and the imperative to follow through on their stated aim – to make Winchester a more cycle-friendly city.
References
-
PLACE VALUE WIKI
https://sites.google.com/view/place-value-wiki/the-evidence ↩ -
WALKING AND CYCLING: THE ECONOMIC BENEFITS.
Summary report by Transport for London
http://content.tfl.gov.uk/walking-cycling-economic-benefits-summary-pack.pdf ↩ ↩2 ↩3 ↩4 -
CYCLING AND THE ECONOMY
Briefing Document July 2016 (Cycling UK)
https://www.cyclinguk.org/sites/default/files/document/migrated/info/economy1fbrf.pdf ↩ ↩2 ↩3 -
THE BENEFITS OF CYCLING: UNLOCKING THEIR POTENTIAL FOR EUROPE.
European Cyclists’ Federation Report, Dec 2018.
https://ecf.com/sites/ecf.com/files/TheBenefitsOfCycling2018.pdf ↩ -
SMART CHOICES FOR CITIES: CYCLING IN THE CITY.
Civitas Policy Note 2020
https://ec.europa.eu/transport/sites/transport/files/cycling-guidance/smart_choices_for_the_city_cycling_in_the_city_0.pdf ↩ ↩2 ↩3 -
BIKE LIFE
2019 Report for Southampton City Council
https://www.sustrans.org.uk/media/5953/bikelife19_southamptoncr_web.pdf ↩ ↩2 -
CYCLE CITY AMBITION (CCA) PROGRAMME
Birmingham, Cambridge , Manchester, Newcastle, Norwich, Oxford, Bristol, Leeds
Interim Report Apr 2019 for DfT http://assets.publishing.service.gov.uk/government/uploads/system/uploads/attachment_data/file/851558/Cycle_City_Ambition_Programme_interim_report_extended_summary.pdf ↩ ↩2 -
‘TRAFFIC CONGESTION COST’
https://inrix.com/press-releases/scorecard-2017-uk/ ↩ -
‘WASTED SPACE’
https://declickenclick.com/2012/10/09/espacio-desperdiciado-una-imagen-iconica/ ↩ -
INVESTING IN CYCLING AND WALKING THE ECONOMIC CASE FOR ACTION.
Department for Transport report, 2015.
https://assets.publishing.service.gov.uk/government/uploads/system/uploads/attachment_data/file/877511/cycling-and-walking-business-case-summary.pdf ↩ ↩2 -
‘LONDON ‘MINI-HOLLAND’ PILOT SCHEME CUTS TRAFFIC BY HALF’.
News item, 2016. Eltis.org
https://www.eltis.org/discover/news/london-mini-holland-pilot-scheme-cuts-traffic-half-uk ↩ -
‘EVAPORATING TRAFFIC? IMPACT OF LOW-TRAFFIC NEIGHBOURHOODS ON MAIN ROADS’.
Post by London Living Streets, July 2019.
https://londonlivingstreets.com/2019/07/11/evaporating-traffic-impact-of-low-traffic-neighbourhoods-on-main-roads/ ↩ -
COPENHAGENIZE YOUR CITY: THE CASE FOR URBAN CYCLING IN 12 GRAPHS.
https://www.theguardian.com/cities/gallery/2018/jun/11/copenhagenize-case-urban-cycling-graphs ↩ -
WORKING TOGETHER TO PROMOTE ACTIVE TRAVEL
Public Health England: a briefing for local authorities
http://assets.publishing.service.gov.uk/government/uploads/system/uploads/attachment_data/file/523460/Working_Together_to_Promote_Active_Travel_A_briefing_for_local_authorities.pdf ↩ -
10 GREAT REASONS TO CYCLE.
Heart Matters.
https://www.bhf.org.uk/informationsupport/heart-matters-magazine/activity/cycling/10-great-reasons-to-cycle ↩ -
THE VALUE OF CYCLING
DfT sponsored research from University of Birmingham & Phil Jones Ass., March 2016.
http://assets.publishing.service.gov.uk/government/uploads/system/uploads/attachment_data/file/509587/value-of-cycling.pdf ↩ ↩2 ↩3 -
”DOES ACTIVE COMMUTING IMPROVE PSYCHOLOGICAL WELLBEING?”
Preventive Medicine, Sep 2014.
https://www.nice.org.uk/news/article/commuting-by-walking-or-cycling-can-boost-mental-wellbeing ↩ -
HEALTH BENEFITS OF COMMUTING CYCLING: A SYSTEMATIC REVIEW
Scandinavian Journal of Medicine & Science and Sports, 2011.
https://onlinelibrary.wiley.com/doi/full/10.1111/j.1600-0838.2011.01299.x ↩ -
ASSOCIATION BETWEEN ACTIVE COMMUTING AND INCIDENT CARDIOVASCULAR DISEASE, CANCER, AND MORTALITY: PROSPECTIVE COHORT STUDY.
British Medical Journal, April 2017.
https://www.bmj.com/content/357/bmj.j1456 ↩ -
RELATIONSHIPS BETWEEN COMMUTING AND SOCIAL CAPITAL
The Journal of Environment and Behavior, 2015.
https://journals.sagepub.com/doi/pdf/10.1177/0013916514529969 ↩ -
ECONOMIC BENEFITS OF INCREASED CYCLING.
Transportation Research Procedia, 2016.
https://www.sciencedirect.com/science/article/pii/S2352146516302538 ↩ -
THE COMPLETE BUSINESS CASE FOR CONVERTING STREET PARKING INTO BIKE LANES
Bloomberg: City Lab report: An overview of all major city studies where parking spaces have been replaced by bike lanes.
https://www.bloomberg.com/news/articles/2015-03-13/every-study-ever-conducted-on-the-impact-converting-street-parking-into-bike-lanes-has-on-businesses ↩ -
Bloomberg interview with Janette Sadik-Khan, 2016.
https://www.bloomberg.com/news/articles/2016-03-10/janette-sadik-khan-on-her-new-book-streetfight ↩ -
THE PEDESTRIAN POUND: The business case for better streets and places.
https://www.livingstreets.org.uk/media/3890/pedestrian-pound-2018.pdf ↩ -
THE VALUE OF THE CYCLING SECTOR TO THE BRITISH ECONOMY: A Scoping Study
C. Newson and L. Sloman, Transport for Quality of Life Ltd, June 2018.
http://s27245.pcdn.co/wp-content/uploads/2018/06/The-Value-of-the-Cycling-Sector-to-the-British-Economy-FINAL2.pdf ↩ -
THE BRITISH CYCLING ECONOMY ‘GROSS CYCLING PRODUCT
Report by London School of Economics, 2011.
http://eprints.lse.ac.uk/38063/1/BritishCyclingEconomy.pdf ↩ -
HIGH STREETS FOR ALL
Report Authored by LSE Cities for Greater London Authority 2017
https://www.london.gov.uk/sites/default/files/high_streets_for_all_report_web_final.pdf ↩ -
STREET APPEAL: THE VALUE OF STREET IMPROVEMENTS
Report prepared by UCL for Transport for London, 2018.
http://content.tfl.gov.uk/street-appeal.pdf ↩ -
THE ECONOMIC BENEFITS OF SUSTAINABLE STREETS
Report by New York City Department of Transportation
www.nyc.gov/html/dot/downloads/pdf/dot-economic-benefits-of-sustainable-streets.pdf ↩ -
THE ASSOCIATION BETWEEN COMMUTER CYCLING AND SICKNESS ABSENCE.
Preventive Medicine, 2010.
https://pubmed.ncbi.nlm.nih.gov/20580736/ ↩ -
HEALTHY STREETS: A BUSINESS VIEW
University of Westminster report for Transport for London, 2018.
http://content.tfl.gov.uk/healthy-streets-a-business-view.pdf ↩ -
SAFE COMMUTING BY BIKE.
Cycling Works
https://cyclingworks.wordpress.com/ ↩ -
CYCLING AND THE MODERN WORKPLACE
http://www.bco.org.uk/Research/Publications/Cycling-and-the-modern-workplace.aspx ↩ ↩2 -
PUBLIC OPINION SURVEY ON TRAFFIC AND ROAD USE: GENERAL PUBLIC RESEARCH
Report by Kantar for Department for Transport, Nov 2020.
https://assets.publishing.service.gov.uk/government/uploads/system/uploads/attachment_data/file/934617/DfT-Public-Opinion-Survey-on-Traffic-and-Road-Use-Phase-1-Report.pdf ↩ -
2019 BIKE LIFE REPORT
Sustrans
https://www.sustrans.org.uk/media/5942/bikelife19_aggregatedreport.pdf ↩ -
YOUGOV POLL
Research for BikeIsBest, July 2020.
https://www.bikeisbest.com/press-release-yougov-study-shows-public-support-cycling-investment ↩ -
YOUGOV POLL
Commissioned for Greenpeace, October 2020.
https://www.theguardian.com/environment/bike-blog/2020/oct/22/despite-a-loud-opposing-minority-low-traffic-neighbourhoods-are-increasingly-popular ↩ -
GUIDE TO ADAPTED CYCLES.
Cycling UK, 2016.
https://www.cyclinguk.org/article/cycling-guide/guide-to-adapted-cycles ↩ -
CYCLE ADAPTATIONS.
Cycling for All.
https://cyclingforall.org/cycles/finding-the-right-cycle/cycle-adaptations/ ↩ -
A GUIDE TO INCLUSIVE CYCLING
Wheels for Wellbeing, 2019 (2nd ed.).
https://wheelsforwellbeing.org.uk/wp-content/uploads/2019/06/FINAL.pdf ↩ -
NATIONAL TRAVEL SURVEY 2019.
https://www.gov.uk/government/collections/national-travel-survey-statistics ↩ -
COPENHAGEN CITY OF CYCLISTS: BICYCLE ACCOUNT 2016
https://bicycleinfrastructuremanuals.com/manuals4/CPH%20bicycle-account-2016.pdf ↩ -
https://www.streetfilms.org/some-things-you-might-see-whil-in-amsterdam/ ↩
-
THE UK’S BEST AND WORST CYCLING CITIES.
BikeRadar, 2016.
https://www.bikeradar.com/features/routes-and-rides/the-uks-best-and-worst-cycling-cities/ ↩ ↩2 -
CAMBRIDGE: BRITAIN’S CYCLING CAPITAL
https://vimeo.com/133736570 ↩ -
ENJOY WALTHAM FOREST PROGRAMME
Video record of outcomes following five years of investment in cycling and other active travel infrastructure.
https://youtu.be/KvVI3Xjpsn4 ↩ -
NEW SEGREGATED CYCLE LANES IN BRISTOL.
https://www.youtube.com/watch?v=qMsCyS-_z6Q ↩